
Jeffrey Schulze, CFA Director, Investment Strategist ClearBridge Investments
Monthly Insights To Help You Stay In Front Of The US Business Cycle
The Anatomy of a Recession (AOR) program is built to deliver thoughtful perspective on the state of the United States economy with concise, practical views updated every month. Our exclusive recession risk and recovery dashboards provide the statistical foundation of our perspective.
- Recession Risk
- Recession Risk by Comparison
- Case Study
Recession Risk
Recession Risk
US Recession Risk Indicators
| Sept. 30, 2026 | June 30, 2026 | March 31, 2026 | ||
|---|---|---|---|---|
|
Consumer
|
Housing Permits | |||
| Job Sentiment | ||||
| Jobless Claims | ||||
| Retail Sales | ||||
| Wage Growth | ||||
|
Business Activity
|
Commodities | |||
| ISM New Orders | ||||
| Profit Margins | ||||
| Truck Shipments | ||||
|
Financial
|
Credit Spreads | |||
| Money Supply | ||||
| Yield Curve | ||||
| Overall Signal |
Data as of September 30, 2026. Sources: BLS, Federal Reserve, Census Bureau, ISM, BEA, American Chemistry Council, American Trucking Association, Conference Board, Bloomberg, CME, FactSet and Macrobond. The ClearBridge Recession Risk Dashboard was created in January 2016. References to the signals it would have sent in the years prior to January 2016 are based on how the underlying data was reflected in the component indicators at the time.
Recession Risk by Comparison
Recession Risk by Comparison
US Recession Risk Indicators
| Current | 2020 | 2007-2009 | 2001 | 1990-1991 | 1981-1982 | 1980 | 1973-1975 | 1969-1970 | ||
|---|---|---|---|---|---|---|---|---|---|---|
|
Confidence
|
Housing Permits | |||||||||
| Job Sentiment | ||||||||||
| Jobless Claims | ||||||||||
| Retail Sales | ||||||||||
| Wage Growth | ||||||||||
|
Economic
|
Commodities | |||||||||
| ISM New Orders | ||||||||||
| Profit Margins | ||||||||||
| Truck Shipments | n/a | n/a | ||||||||
|
Financial
|
Credit Spreads | |||||||||
| Money Supply | ||||||||||
| Yield Curve | ||||||||||
| Overall Signal |
Data as of September 30, 2026. Sources: BLS, Federal Reserve, Census Bureau, ISM, BEA, American Chemistry Council, American Trucking Association, Conference Board, Bloomberg, CME, FactSet and Macrobond. The ClearBridge Recession Risk Dashboard was created in January 2016. References to the signals it would have sent in the years prior to January 2016 are based on how the underlying data was reflected in the component indicators at the time.
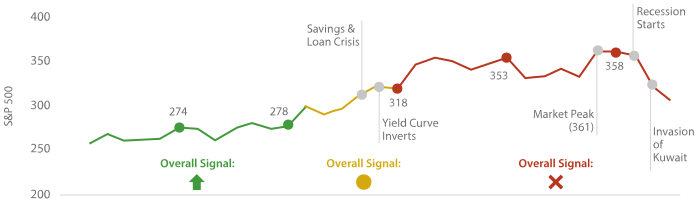
Case Study
| Q2 1988 | Q4 1988 | Q2 1989 | Q4 1989 | Q2 1990 | ||
|---|---|---|---|---|---|---|
|
Consumer
|
Housing Permits | |||||
| Job Sentiment | ||||||
| Jobless Claims | ||||||
| Retail Sales | ||||||
| Wage Growth | ||||||
|
Business Activity
|
Commodities | |||||
| ISM New Orders | ||||||
| Profit Margins | ||||||
| Truck Shipments | ||||||
|
Financial
|
Credit Spreads | |||||
| Money Supply | ||||||
| Yield Curve |
Source: S&P, FactSet, NBER, and Bloomberg.
Resources
Insights


I agree to be contacted by Franklin Templeton and understand that I am providing the e-mail address which is used for business-related purposes.